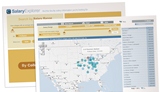
SALARY EXPLORER: See Faculty-Salary Data for More Than 1,300 Colleges
STORY: Experience Doesn’t Always Pay
DATABASE: Search the Results of the AAUP Survey
| Where Professors Earn the Most | |
| Average salaries, 2010-11 | |
| Highest-paid full professors, all private institutions | |
| Harvard U. | $193,800 |
| Columbia U. | $191,400 |
| U. of Chicago | $190,400 |
| Stanford U. | $188,400 |
| Princeton U. | $186,000 |
| Highest-paid full professors, all public institutions | |
| New Jersey Institute of Technology | $158,700 |
| U. of California at Los Angeles | $153,700 |
| U. of California at Berkeley | $149,100 |
| U. of Michigan at Ann Arbor | $146,900 |
| U. of Maryland at Baltimore | $144,800 |
| Note: The figures cover full-time members of the instructional staff except those in medical schools. The salaries are adjusted to a standard nine-month work year. | |
| Source: American Association of University Professors | |
We're sorry. Something went wrong.
We are unable to fully display the content of this page.
The most likely cause of this is a content blocker on your computer or network.
Please allow access to our site, and then refresh this page. You may then be asked to log in, create an account if you don't already have one, or subscribe.
If you continue to experience issues, please contact us at 202-466-1032 or help@chronicle.com